When an application is slow, measuring in network protocols can help. This way, you gain insight into data flows. There are many tools for this. The most well-known tool is Wireshark. In this blog I will give some tips on measuring in network protocols. Because Wireshark has some shortcomings, I also offer an alternative: the Observer Protocol Analyzer.
Why measure?
Measuring with Wireshark or more advanced tools is very useful to gain insight into data streams. This allows you to discover invisible errors and thus more quickly and effectively identify causes why an application is slow, for example, or what the application is waiting for.
A protocol consists of data but also technical management information. You can do a lot with this information. For example, you can determine if the server is too busy. Or that the information is not being received and needs to be sent multiple times. There are protocols that provide very detailed information about errors. However, you’re not going to find these in log files from Windows, switches or application.
You may discover the following errors when you start measuring in protocols:
- Where is the slowness? Is it in the server side, workstation or network?
- Is it in the application? Or is it in out of specs working hardware?
- Does it involve application errors? With a protocol analyzer, you can literally see every bit and byte and what is going right and wrong. The advantage of Observer is that you can, for example, generate an overview of the errors that are present with one click. This gives you an overview for yourself or for the specialist.
- Are there network errors? Quality of Service problems can be demonstrated or MTU MSS values. Is traffic routing running as configured? In practice, we often see that it is not.
- Communication errors from Operating systems. With a Protocol Analyzer, you can show how Windows handles traffic, for example. And what are Microsoft’s buffer sizes toward the network and applications? Also, you can determine if there are queues.
What is a network protocol?
First, the definition of a network protocol. A network protocol is a protocol with an agreed-upon communication method for network components. By applying a standard protocol, components from different vendors or manufacturers can exchange data with each other.
Without agreements on standards, communication between sender and receiver is not possible. The path between sender and receiver consists of a chain of hardware and software. It is therefore important to speak the same language, which is called a protocol. There are vendor-dependent protocols but many network protocols are standard protocols such as the TCP and IP protocol.
How does a protocol work?
Simply put, a protocol works with a transmitter and the receiver. On both systems, the protocol will have to be set up and work. Basically, there will always be a start phase, a data transfer or task and a shutdown phase. In today’s IT environment, the following protocols are active: an Ethernet protocol, a TCP/IP protocol and an application protocol.
A protocol is active at an OSI layer. The OSI model has 7 layers. See https://nl.wikipedia.org/wiki/OSI-model. Between these layers there is transfer of data or a task. This very exchange is sometimes a major challenge that can cause performance problems.
Troubleshooting with protocols
Reading protocols provides a lot of information. Not only quantity of data transferred but certainly also substantive information about anomalies and failures. There are many free tools on the worldwide web for measuring protocols. The trick is to measure correctly and have all the data in the protocols at hand. Missing data packets is not desirable. Proper diagnosis is then not possible. I myself therefore use Observer, but sometimes also Wireshark.
Wireshark
Wireshark is probably the most well-known tool. This Protocol Analyzer has the big advantage of being free. The data packets are listed below each other and by applying filters you can make analyses between sender and receiver. The disadvantage is that finding problems in protocols requires a lot of knowledge of Wireshark and also in-depth technical knowledge of protocols. Thus, to make a good diagnosis with Wireshark, you need a lot of flying hours with this tool. Practice shows that finding the real cause of the problem is a big challenge and often takes a lot of time.
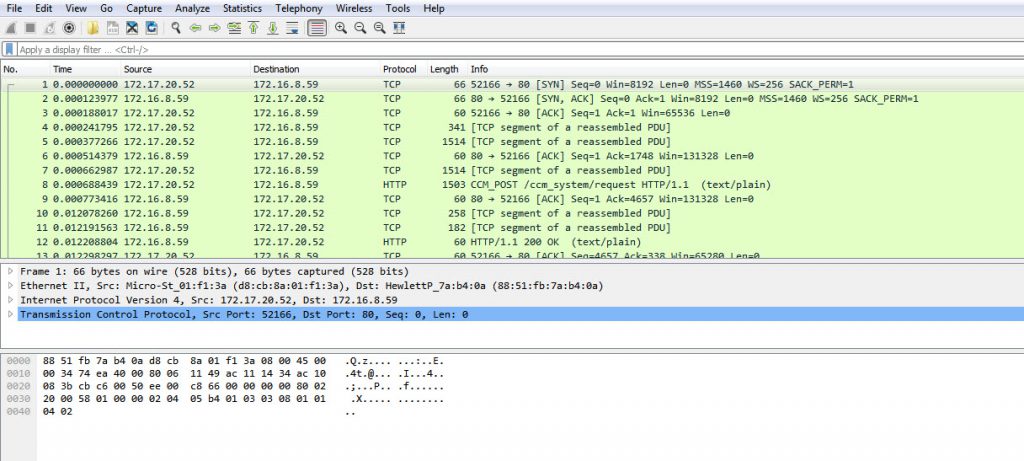
Wireshark information, analysis means search packets without helicoper overview.
Observer Protocol Analyzer
Basically, with the Observer toolset you obtain much more information from the measurements. The accuracy of the measurements is much higher because memory is reserved in Windows, for example. As a result, computers do not crash when measuring and analyzing data. With the right mouse button you conjure the right information out of the top hat for you or your colleagues in a few actions. Easily generating an overview with errors this way saves a lot of time. The disadvantage of the Observer Protocol Analyzer is that it is not free. With regular use, however, the tool pays for itself easily and quickly.
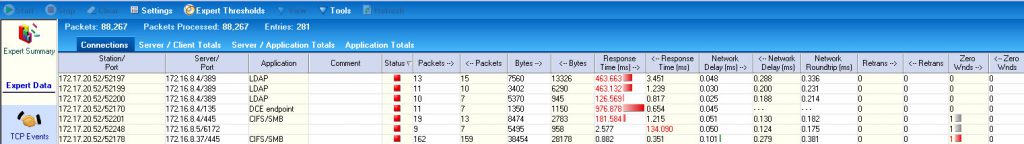
Observer Expert screen with overview. Where is it slow, what is going wrong or right. Zooming in is a matter of right click.
Start measuring
If you are not yet measuring, I recommend starting with a simple free tool. If there are daily problems, a more advanced tool is in order equipped with an Expert system that aids in analyzing thousands of data packets. Diagnoses are then substantiated with graphs, causes and roadmaps.
Good luck with the measurements and analyzing the protocols.
If you want to know more about this, feel free to call us!